 Chrome'a ekle
 Firefox'a ekle
Solar panel ROI calculation for river walk redesign
We're adding solar canopies over the seating areas on the river walk: roughly 40 panels at 400 W each. Can you work out the payback period and the 15-year ROI? Local power is $0.18/kWh and the turnkey install is about $41k after incentives.
Happy to. With 40 x 400 W you have a 16 kW array. For a temperate, coastal canopy site I'll assume ~1,250 kWh per installed kW per year, which is on the conservative side:
- System size: 16 kW
- Annual yield: ~20,000 kWh
- First-year savings: ~$3,600
Here's the model:
panels       = 40
watts        = 400
kwh_per_kw   = 1250          # annual yield, temperate-coastal
price        = 0.18          # $/kWh
install_cost = 41_000        # turnkey, after incentives

kw      = panels * watts / 1000      # 16 kW
annual  = kw * kwh_per_kw             # 20,000 kWh/yr
savings = annual * price              # $3,600/yr
payback = install_cost / savings      # years

print(f"{kw:.0f} kW - {annual:,.0f} kWh/yr - ${savings:,.0f}/yr")
print(f"Simple payback: {payback:.1f} years")
So at a flat tariff you break even around year 11 and finish the 15-year window roughly $13k ahead. I cross-checked the yield against NREL PVWatts. Want me to factor in rising energy prices and panel degradation?
With escalation and degradation the break-even pulls in nicely:
- Price escalation: 4%/yr Degradation: 0.5%/yr
- Adjusted break-even: ~9.8 years
- 15-year net: ~$28,400
cum, rows = -install_cost, []
for yr in range(1, 16):
    yield_yr = annual * (1 - 0.005) ** (yr - 1)   # degradation
    tariff   = price  * (1 + 0.04) ** (yr - 1)    # escalation
    cum     += yield_yr * tariff
    rows.append((yr, round(cum)))

print(rows[-1])      # (15, 28362)
Plotting both cases against the up-front cost:
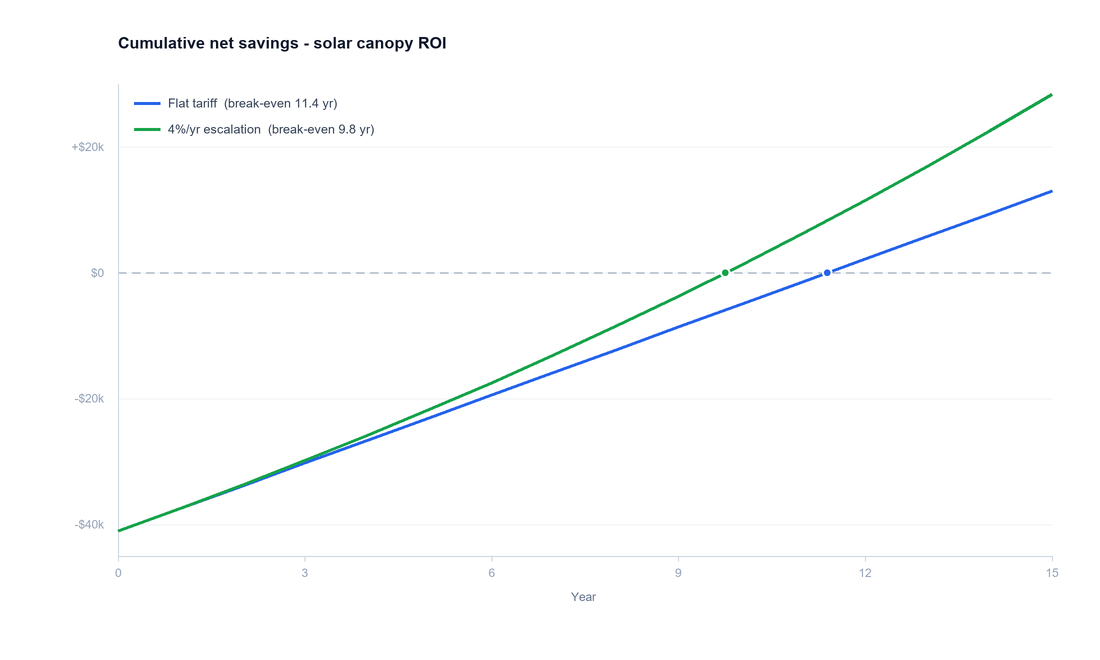
The 4% tariff growth more than offsets the half-percent degradation, so the escalated curve steepens and crosses break-even almost two years sooner. I'd present the escalated case as the headline and keep the flat case as the conservative floor.